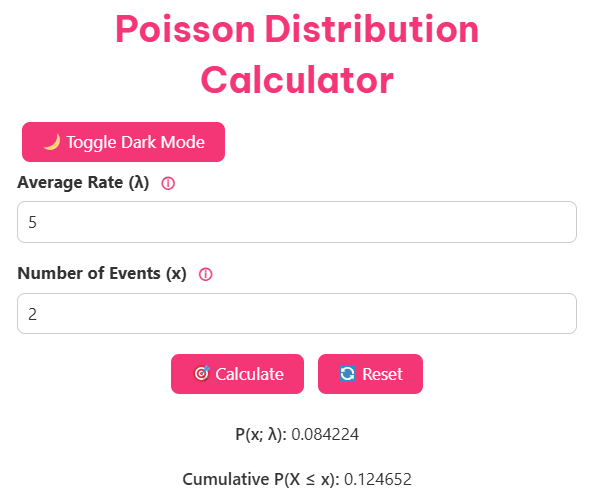
Poisson Distribution Calculator
P(x; λ): -
Cumulative P(X ≤ x): -
Cumulative P(X ≥ x): -
Understanding probability distributions can transform how you analyze events and make data-driven decisions. The Poisson distribution stands out as one of the most practical tools for predicting events that occur randomly over fixed intervals. Whether you’re a student tackling statistics homework, a data scientist forecasting customer arrivals, or a business professional planning resource allocation, our free Poisson distribution calculator 2025 simplifies complex probability calculations.
What is Poisson Distribution?
The Poisson distribution is a discrete probability distribution that describes the likelihood of a specific number of events occurring within a fixed interval of time, space, or other measurable units. Named after French mathematician Siméon Denis Poisson, this distribution excels at modeling rare events that happen independently at a constant average rate.
Unlike continuous distributions that can take any real number value, the Poisson distribution works exclusively with non-negative integers (0, 1, 2, 3, and so on). This makes it particularly useful for counting occurrences rather than measuring quantities.
Key Characteristics of Poisson Distribution
The Poisson distribution operates under specific assumptions that make it reliable for certain types of events:
- Independence: Each event occurs independently of others
- Constant rate: The average rate of occurrence remains consistent over time
- Rare events: The probability of multiple events occurring simultaneously is negligible
- Known average: You must know the historical average rate of occurrence
Understanding Key Elements
Lambda (λ): The Rate Parameter
Lambda represents the average number of events expected to occur during the specified interval. This parameter serves as both the mean and variance of the Poisson distribution, making it uniquely straightforward among probability distributions.
For example, if a coffee shop serves an average of 15 customers per hour, then λ = 15. This single value contains all the information needed to calculate various probabilities using the Poisson formula.
X: The Random Variable
X represents the actual number of events you want to analyze. This could be any non-negative integer, depending on what you’re trying to predict or understand.
Continuing with the coffee shop example, if you want to know the probability of serving exactly 12 customers in the next hour, then X = 12.
The Poisson Formula Explained
The mathematical foundation of Poisson probability calculations follows this formula:
P(X = x) = (e^-λ × λ^x) / x!
Where:
- P(X = x) is the probability of exactly x events occurring
- e is Euler’s number (approximately 2.71828)
- λ is the average rate of occurrence
- x is the specific number of events
- x! represents x factorial
While this formula might appear complex, our calculator handles all computations automatically, delivering accurate results instantly.
Mean and Variance Relationship
One distinctive feature of the Poisson distribution is that its mean equals its variance, both equal to λ. This relationship provides a quick way to verify whether your data follows a Poisson pattern. The standard deviation equals the square root of λ, offering insights into the typical spread of your data around the average.
Using Our Free Poisson Distribution Calculator 2025
Our advanced calculator streamlines probability calculations while maintaining the highest accuracy standards. Built with user experience at its core, the tool accommodates everyone from beginners to statistical experts.
Unique Features and Benefits
User-Friendly Interface: Our intuitive design ensures ease of use, featuring clear input fields and straightforward navigation that makes complex calculations accessible to users at any skill level.
Versatile Calculations: Calculate both individual probabilities (exactly x events) and cumulative probabilities (less than, at most, more than, or at least x events) with a single tool.
High Accuracy: Based on the latest statistical methods and rigorous testing, our calculator provides precise and reliable results you can trust for critical decisions.
Completely Free: Access all features without subscriptions, hidden fees, or registration requirements.
Mobile-Friendly Design: Seamlessly functional across all devices, from smartphones to tablets to desktop computers.
Real-Time Results: Instant calculations appear with the press of a button, eliminating waiting time and streamlining your workflow.
Comprehensive Error Handling: Clear, informative error messages guide you toward correct inputs and proper calculator usage.
Step-by-Step Usage Guide
- Select Probability Type: Choose from the dropdown menu whether you want to calculate exactly x events, less than x events, at most x events, more than x events, or at least x events.
- Enter Lambda (λ): Input the average rate of occurrence for your specific scenario. This should be a positive number representing the expected number of events during your chosen interval.
- Input X Value: Enter the number of events for which you want to calculate the probability. This must be a non-negative integer (0, 1, 2, 3, etc.).
- Calculate Results: Click the calculate button to generate your probability results instantly.
- Review Output: Examine the detailed results, which include both the specific probability you requested and related probability values for comprehensive analysis.
Types of Calculations Available
Individual Probability P(X = x): Calculates the exact probability of observing precisely x events.
Cumulative Probability P(X ≤ x): Determines the probability of observing x or fewer events.
Complementary Probability P(X > x): Finds the probability of observing more than x events.
Left-tail Probability P(X < x): Computes the probability of observing fewer than x events.
Right-tail Probability P(X ≥ x): Calculates the probability of observing x or more events.
Practical Examples and Use Cases
Example 1: Customer Service Optimization
A tech support center receives an average of 8 customer calls per hour. The manager wants to determine the probability of receiving exactly 10 calls during the next hour to plan staffing appropriately.
Given: λ = 8, X = 10
Calculation: P(X = 10) = (e^-8 × 8^10) / 10!
Result: Approximately 0.099 or 9.9%
Example 2: Healthcare Resource Planning
An emergency room treats an average of 12 patients during weekend nights. The hospital administrator needs to know the probability of treating 15 or fewer patients to ensure adequate staffing.
Given: λ = 12, X ≤ 15
Calculation: P(X ≤ 15) = Sum of P(X = 0) through P(X = 15)
Result: Approximately 0.844 or 84.4%
Example 3: Manufacturing Quality Control
A production line typically produces 2 defective items per 1,000 units manufactured. The quality manager wants to assess the probability of finding more than 3 defects in the next batch.
Given: λ = 2, X > 3
Calculation: P(X > 3) = 1 – P(X ≤ 3)
Result: Approximately 0.143 or 14.3%
When NOT to Use Poisson Distribution
Understanding limitations prevents misapplication and ensures reliable results:
Dependent Events: Avoid using Poisson distribution when events influence each other. For example, social media viral content spreads through networks where each share influences future shares.
Variable Rates: The distribution assumes constant average rates. If your event rate changes significantly over time due to trends, seasons, or external factors, Poisson may not provide accurate results.
Zero Impossibility: Some scenarios cannot have zero occurrences. For instance, once a patient enters a hospital, they cannot stay zero days. These situations require modified approaches like zero-truncated Poisson distributions.
Large Numbers: Extremely large values of x can cause computational difficulties and may indicate that other distributions (like normal approximation) might be more appropriate.
Start Making Better Predictions Today
The Poisson distribution calculator 2025 represents more than just a computational tool, it’s your gateway to better understanding random events and making informed decisions based on solid statistical foundations. Whether you’re optimizing business operations, conducting academic research, or satisfying personal curiosity about probability, our free calculator provides the accuracy and functionality you need.
Try Our Free Calculator!