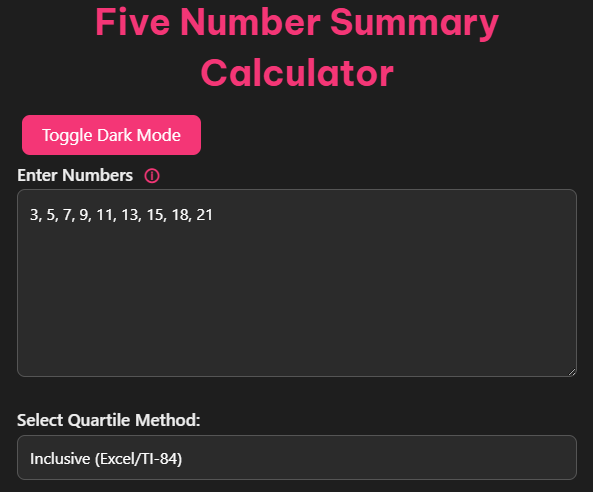
Five Number Summary & IQR Calculator
You can switch between inclusive and exclusive quartile methods below.
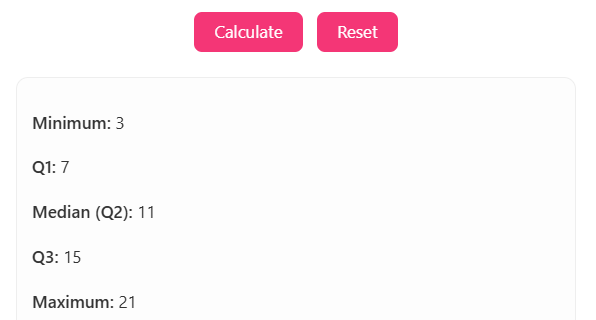
Minimum: -
Q1: -
Median (Q2): -
Q3: -
Maximum: -
Interquartile Range (IQR): -
Whether you’re a student tackling challenging statistics problems, a data analyst summarizing insights, or even a financial expert making sense of datasets, the five-number summary is one of the simplest yet most powerful tools in your statistics toolkit. Best of all? You don’t have to do it manually! Meet our free five-number summary calculator, the ultimate tool for quick and accurate data analysis.
What Is a Five-Number Summary? Why Is It Important?
The five-number summary is a statistical concept designed to provide a quick snapshot of your dataset. It consists of five key values:
- Minimum: The smallest value in your dataset.
- Q1 (First Quartile): The value below which 25% of the data falls.
- Median (Q2): The middle value, dividing the dataset into two equal halves.
- Q3 (Third Quartile): The value below which 75% of the data falls.
- Maximum: The largest value in your dataset.
Why It Matters
- Ease of Analysis: Instead of wading through countless data points, the five-number summary distills key insights for quick analysis.
- Understanding Data Distribution: Spot trends, identify outliers, and understand data spread at a glance.
- Visual Communication: Enables the creation of box-and-whisker plots for intuitive data visualization.
How to Calculate the Five-Number Summary by Hand
Knowing how to calculate a five-number summary manually can be invaluable. Here’s a step-by-step guide using a hands-on example:
Steps:
- Sort Your Data in Ascending Order
Example dataset (unsorted): 5, 2, 7, 11, 9, 12, 18, 15, 21
Sorted dataset: 2, 5, 7, 9, 11, 12, 15, 18, 21
- Find the Minimum and Maximum Values
- Minimum = 2
- Maximum = 21
- Calculate the Median (Q2)
The median is the middle value.
- Middle value = 11 (5th position in the dataset).
- Determine Q1 and Q3
- Q1 (median of the lower half): Median of 2, 5, 7, 9 = (5 + 7)/2 = 6
- Q3 (median of the upper half): Median of 12, 15, 18, 21 = (15 + 18)/2 = 16.5
Final result for the example dataset:
- Min = 2
- Q1 = 6
- Median (Q2) = 11
- Q3 = 16.5
- Max = 21
Major Pitfall
For large datasets or grouped data, manual calculations can be tedious and error-prone. This is exactly where our free calculator can help.
Why Use Our Free Five-Number Summary Calculator?
- Instant Results
Forget sorting and manual medians. Input your dataset, and the calculator provides Minimum, Q1, Median, Q3, and Maximum instantly.
- User-Friendly Interface
Whether you’re on desktop or mobile, easily input data with our intuitive design.
- Handles Large and Complex Data
From short datasets to thousands of numerical points, our calculator can handle it all.
- Additional Features
- Automatically validates data input.
- Includes step-by-step explanations.
- Provides a box-and-whisker plot for instant data visualization.
- Free Forever
No hidden charges, subscriptions, or catches. You can analyze as many datasets as you like.
Interpreting the Five-Number Summary
The numbers themselves tell a story about your data. Here’s how to interpret them effectively:
1. Spread and Range
- The range (Max – Min) tells you the total spread of your dataset.
- The interquartile range (IQR = Q3 – Q1) highlights the middle 50% of your data, cutting through extremes.
2. Distribution
- If Q1 and Q3 values are close to the median, your dataset might be symmetrical.
- If Q1 and Q3 are far apart, expect a skewed dataset.
3. Outliers
Box-and-whisker plots (derived from the five-number summary) make it easy to spot outliers that can skew your analysis.
Creating and Interpreting Box-and-Whisker Plots
Once you have your five-number summary, you can create a box-and-whisker plot to visualize your data. Here’s how:
- Box Construction
- Draw a box from Q1 to Q3.
- Add a line inside the box at the median (Q2).
- Whiskers
Extend whiskers to the Min and Max values.
- Outliers
Mark any data points beyond 1.5x the IQR as outliers.
Visualizing it this way makes it easier to interpret data distribution at a glance.
Examples of Five-Number Summaries
Example 1:
Dataset = 3, 7, 8, 5, 12, 14, 21, 13, 18
Steps:
- Sorted dataset = 3, 5, 7, 8, 12, 13, 14, 18, 21
- Min = 3, Q1 = 6, Median (Q2) = 12, Q3 = 16, Max = 21
Result = 3, 6, 12, 16, 21
Example 2:
Dataset = -5, -4, -3, 0, 1, 2, 2, 4, 5, 6, 7, 7
Steps:
- Q1 = -1.5, Median = 2, Q3 = 5.5
Result = -5, -1.5, 2, 5.5, 7
Frequently Asked Questions
How accurate is the calculator compared to manual calculations?
Our calculator is designed to be 100% accurate for both small and large datasets. It employs validated statistical algorithms to ensure precision.
Can it handle negative numbers and decimals?
Yes, the calculator fully supports datasets with negative numbers, decimals, and even very large numbers.
Are there dataset size limits?
No practical size limit exists; our calculator efficiently processes datasets of all sizes.
Final Thoughts on Data Analysis
Mastering data analysis begins with simple tools like our five-number summary. By summarizing your dataset into five easily interpretable values, you can reveal the story behind the numbers and make more informed decisions.
Save time, improve accuracy, and take your analysis to the next level with our free five-number summary calculator.