Mean Absolute Deviation (MAD) Calculator
Data analysis has never been more crucial for making informed decisions. Whether you’re a financial analyst evaluating portfolio risk, a quality control manager monitoring product consistency, or a student learning statistical concepts, understanding data variability is essential. The Mean Absolute Deviation (MAD) offers a straightforward approach to measuring this variability and our free MAD calculator 2025 makes the process effortless.
Tip: Want to measure how far your value is from the expected result? Try our Percent Error Calculator.
Understanding Mean Absolute Deviation (MAD)
Mean Absolute Deviation represents the average distance between each data point and the dataset’s mean. Unlike other measures of variability, MAD uses absolute differences, making it more intuitive and less sensitive to extreme values.
The MAD formula is:
MAD = Σ|xi – x̄| / n
Where:
- xi = each individual value in the dataset
- x̄ = the mean of all values
- n = total number of values
- |xi – x̄| = absolute difference between each value and the mean
This straightforward calculation provides a clear picture of how much your data typically varies from the average, expressed in the same units as your original data.
How to Calculate Mean Absolute Deviation Step-by-Step
Calculating MAD manually involves four simple steps, though our calculator automates this entire process for you.
Step 1: Calculate the Mean

Add all values in your dataset and divide by the number of observations.
Step 2: Find Absolute Deviations
Subtract the mean from each data point and take the absolute value to eliminate negative signs.
Step 3: Sum the Absolute Deviations
Add up all the absolute deviations calculated in step 2.
Step 4: Calculate the MAD
Divide the sum of absolute deviations by the total number of data points.
Example Calculation: Small Dataset
Let’s work through a simple example with the dataset: 2, 7, 15, 22
Step 1: Calculate the mean
Mean = (2 + 7 + 15 + 22) ÷ 4 = 46 ÷ 4 = 11.5
Step 2: Calculate absolute deviations
- |2 – 11.5| = 9.5
- |7 – 11.5| = 4.5
- |15 – 11.5| = 3.5
- |22 – 11.5| = 10.5
Step 3: Sum the absolute deviations
9.5 + 4.5 + 3.5 + 10.5 = 28
Step 4: Calculate MAD
MAD = 28 ÷ 4 = 7
This means that, on average, each value in the dataset deviates from the mean by 7 units.
When to Use Mean Absolute Deviation
MAD proves particularly valuable in specific analytical situations where its unique properties provide clearer insights than alternative measures.
Advantages of Using MAD
Intuitive Interpretation: MAD results are expressed in the same units as your original data, making them immediately understandable. If you’re measuring temperatures in Celsius, your MAD will also be in Celsius.
Outlier Resistance: Unlike standard deviation, which squares deviations and amplifies the influence of extreme values, MAD treats all deviations equally. This makes it ideal for datasets containing outliers that shouldn’t dominate your analysis.
Simplicity: The calculation process is straightforward, making MAD accessible to users with varying statistical backgrounds.
MAD vs. Standard Deviation: A Practical Comparison
Consider this dataset with an outlier: 10, 12, 15, 18, 100
Standard Deviation Calculation:
- Mean = 31
- Squared deviations: 441, 361, 256, 169, 4761
- Standard deviation = 37.2
MAD Calculation:
- Mean = 31
- Absolute deviations: 21, 19, 16, 13, 69
- MAD = 27.6
The outlier (100) dramatically inflates the standard deviation but has a more proportional effect on MAD, providing a more representative measure of typical variation.
Optimal Use Cases for MAD
Financial Analysis: Portfolio managers use MAD to assess investment risk when extreme market movements shouldn’t overshadow typical performance patterns.
Quality Control: Manufacturing companies rely on MAD to monitor product consistency, especially when occasional defects shouldn’t skew overall quality assessments.
Forecast Accuracy: Sales teams evaluate prediction accuracy using MAD to understand typical forecasting errors without extreme deviations dominating the analysis.
Real-World Applications and Examples
Financial Portfolio Analysis
A portfolio manager evaluates two investment options:
Portfolio A Returns: 8%, 9%, 10%, 11%
- Mean = 9.5%
- MAD = 1.25%
Portfolio B Returns: 5%, 7%, 12%, 16%
- Mean = 10%
- MAD = 3.5%
Despite Portfolio B’s higher average return, Portfolio A offers more consistent performance with lower variability, making it potentially more suitable for risk-averse investors.
Quality Control in Manufacturing
A manufacturing company monitors product weights with the following sample: 48g, 50g, 51g, 49g, 52g
- Mean weight = 50g
- MAD = 1.2g
This MAD indicates that product weights typically vary by 1.2 grams from the target weight, helping quality control teams set appropriate tolerance levels.
Sales Forecast Accuracy Assessment
A sales team compares forecasted versus actual monthly sales:
- Forecasted: $100K, $110K, $95K, $105K
- Actual: $98K, $115K, $92K, $108K
- Absolute differences: $2K, $5K, $3K, $3K
- MAD = $3.25K
This MAD shows that forecasts typically deviate from actual sales by $3,250, providing a concrete measure of prediction accuracy.
Our Free MAD Calculator 2025: Features and Benefits
Our calculator addresses common gaps found in competitor tools while providing enhanced functionality for modern data analysis needs.
Key Calculator Features
Comma-Separated Input: Simply enter your data points separated by commas for instant processing.
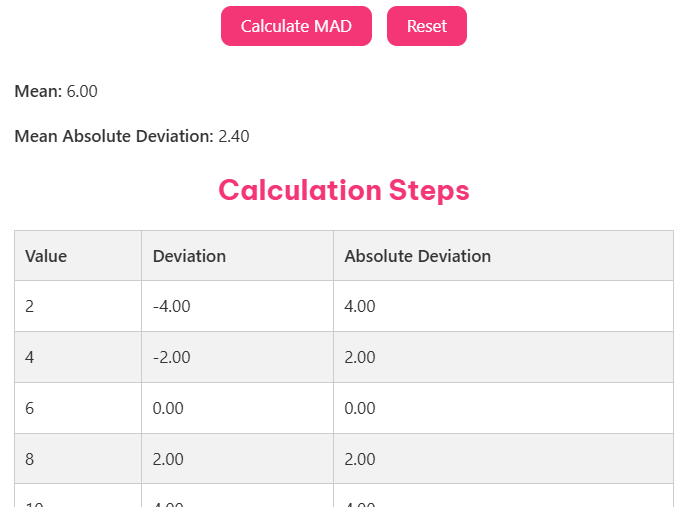
Step-by-Step Process Display: View each calculation step to understand the methodology and verify results.
Clear MAD Results: Get your Mean Absolute Deviation value prominently displayed with proper formatting.
Reset Functionality: Quickly clear inputs for new calculations without refreshing the page.
Responsive Design: Access the calculator seamlessly across desktop, tablet, and mobile devices.
Large Dataset Support: Handle both small samples and extensive datasets efficiently.
Error Handling: Receive clear feedback for invalid inputs with suggestions for correction.
Mean Display: View both the dataset mean and MAD for comprehensive analysis.
Individual Deviations: See absolute deviations for each data point to identify patterns.
Usage Instructions: Access clear, concise guidance directly within the calculator interface.
Competitive Advantages
After analyzing leading competitors our tool addresses several identified gaps:
Enhanced User Experience: Streamlined interface reduces calculation time and minimizes user errors.
Comprehensive Output: Unlike basic calculators that only provide final results, we show the complete analytical process.
Educational Value: Built-in explanations help users understand MAD concepts while performing calculations.
Mobile Optimization: Superior mobile experience compared to competitors with limited responsive design.
Advanced Error Handling: Proactive input validation prevents common calculation errors.
Simplify Data Analysis Today
Mean Absolute Deviation provides a powerful yet accessible approach to understanding data variability. Whether you’re analyzing financial portfolios, monitoring quality control processes, or evaluating forecast accuracy, MAD offers insights that standard deviation might obscure through outlier sensitivity.
Our free MAD calculator 2025 eliminates the complexity of manual calculations while providing educational value through transparent processes. With features designed based on comprehensive competitor analysis, we’ve addressed common user pain points while delivering professional-grade accuracy.
Ready to streamline your statistical analysis? Access our free Mean Absolute Deviation calculator and discover how simple data analysis can be. No registration required, no hidden fees, just powerful, accurate calculations at your fingertips.