P-Score (p-Value) Calculator
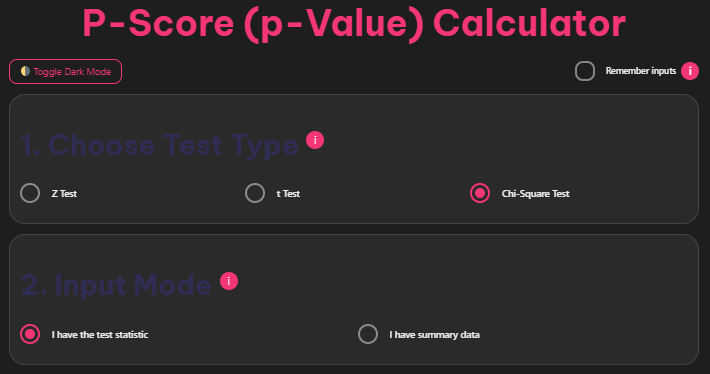
1. Choose Test Type
i2. Input Mode
iEnter Observed & Expected counts (comma or line separated, same length).
3. Test Statistic Entry
i4. Tail & Alpha
iResults
iUnderstanding statistical significance is crucial for making data-driven decisions across research, business, and academic fields. Our free P-value calculator simplifies the complex process of determining statistical significance, helping you interpret your research findings with confidence.
What is a P-Value?
A p-value measures the probability of obtaining your observed results, or more extreme results, assuming the null hypothesis is true. Think of it as a statistical compass that points toward the significance of your findings.
The p-value ranges from 0 to 1, where:
- Lower p-values (typically ≤ 0.05) suggest strong evidence against the null hypothesis
- Higher p-values (> 0.05) indicate insufficient evidence to reject the null hypothesis
Understanding Statistical Hypotheses
Before diving into p-value calculations, it’s essential to understand the foundation of hypothesis testing:
Null Hypothesis (H₀)
The null hypothesis represents the default assumption that there is no significant difference, relationship, or effect in your data. It’s the hypothesis you’re trying to disprove.
Alternative Hypothesis (H₁)
The alternative hypothesis suggests that there is a significant difference, relationship, or effect. This is what you’re trying to prove through your statistical test.
Introducing Our Free P-Value Calculator
Our comprehensive p-value calculator supports multiple statistical tests and provides instant, accurate results. Unlike basic calculators that only handle simple scenarios, our tool accommodates various input formats and offers detailed explanations to enhance your understanding.
Key Features:
- Multiple Test Support: Z-test, T-test, Chi-square test, and F-test
- Flexible Testing Options: Both one-tailed and two-tailed p-value calculations
- High Precision Results: Ensures reliability for critical statistical analysis
- User-Friendly Interface: Compatible with various input formats (integers, decimals, fractions)
- Device Compatibility: Accessible on desktop, tablet, and mobile devices
- Completely Free: No registration required, ad-free experience
Statistical Tests and P-Value Calculations
Z-Test Applications
The Z-test is ideal for large sample sizes (typically n ≥ 30) when the population standard deviation is known. It follows the standard normal distribution N(0,1).
Common Z-test scenarios:
- Testing population means with known variance
- Comparing two population proportions
- Quality control in manufacturing processes
T-Test Applications
The T-test is perfect for smaller sample sizes or when the population standard deviation is unknown. It follows the Student’s t-distribution.
T-test variations:
- One-sample t-test (comparing sample mean to population mean)
- Two-sample t-test (comparing means of two groups)
- Paired t-test (comparing before/after measurements)
Chi-Square Test Applications
Chi-square tests examine relationships between categorical variables and assess goodness-of-fit.
Chi-square test uses:
- Testing independence between variables
- Goodness-of-fit testing
- Analyzing contingency tables
F-Test Applications
F-tests compare variances and are commonly used in ANOVA (Analysis of Variance) to test equality of means across multiple groups.
F-test applications:
- Comparing variances between groups
- Testing overall model significance in regression
- ANOVA for multiple group comparisons
How to Use Our P-Value Calculator
Follow these simple steps to calculate your p-value:
- Select your test type: Choose from Z-test, T-test, Chi-square, or F-test
- Choose tail direction: Select one-tailed (left or right) or two-tailed testing
- Input your test statistic: Enter the calculated value from your statistical test
- Add degrees of freedom: If applicable (for t-test, chi-square, or F-test)
- Get instant results: View your p-value with clear interpretation

Real-World P-Value Examples
A/B Testing in Marketing
A digital marketing team compares two webpage versions to determine which generates higher conversion rates. With a p-value of 0.03, they can confidently conclude that one version significantly outperforms the other, justifying the implementation of the winning design.
Medical Research Applications
In clinical trials, researchers evaluate a new blood pressure medication against a placebo. A p-value of 0.01 provides strong evidence that the medication significantly reduces blood pressure compared to the placebo, supporting its potential therapeutic value.
Quality Control in Manufacturing
A production manager monitors product weight consistency. A p-value of 0.20 suggests that weight variations fall within acceptable random variation limits, indicating the manufacturing process meets quality standards.
Financial Analysis
When analyzing stock correlations, a low p-value indicates that the relationship between two stocks is statistically significant, suggesting they tend to move together rather than by chance.
Educational Research
Researchers comparing student performance between tutoring groups and control groups use t-tests. A p-value of 0.02 demonstrates that tutoring significantly improves test scores.
Clinical Trial Analysis
Medical researchers assessing whether a new drug reduces symptoms compared to existing treatments rely on p-values to determine treatment efficacy and safety.
Marketing Campaign Evaluation
Businesses testing whether new marketing campaigns significantly increase website traffic use statistical tests to measure campaign effectiveness and optimize future strategies.
Customer Satisfaction Studies
Companies evaluating whether service improvements significantly enhance customer satisfaction scores use p-values to validate the impact of their initiatives.
Common P-Value Misconceptions
Misconception 1: P-Value Equals Hypothesis Truth Probability
A p-value of 0.05 doesn’t mean there’s a 95% chance your hypothesis is correct. It indicates a 5% probability of observing your results if the null hypothesis were true.
Misconception 2: P-Value Indicates Effect Size
Statistical significance doesn’t equal practical importance. A very small p-value might indicate a statistically significant but practically negligible effect, especially with large sample sizes.
Misconception 3: P-Hacking Acceptability
Conducting multiple tests until finding a significant p-value (p-hacking) undermines research integrity and leads to false discoveries.
Frequently Asked Questions
How does the calculator handle very large datasets?
Our calculator efficiently processes large datasets while maintaining computational accuracy. The underlying algorithms are optimized for performance regardless of data size.
Can the calculator be used for non-parametric tests?
Currently, our calculator supports Z-test, T-test, Chi-square test, and F-test. We’re continuously expanding our capabilities to include additional statistical tests.
What measures ensure the calculator’s accuracy?
Our calculator uses established statistical formulas and undergoes rigorous testing. We regularly validate results against known statistical software to ensure precision.
Does the calculator store or share my data?
No, we prioritize your privacy. All calculations are performed locally, and we don’t store, share, or access your input data.
Is there a cost associated with using the calculator?
Our p-value calculator is completely free to use with no hidden fees, subscriptions, or registration requirements.
Maximize Your Statistical Analysis
Our free p-value calculator represents a significant advancement over competitors by offering comprehensive test support, detailed explanations, and a user-friendly interface. Whether you’re conducting academic research, business analysis, or quality control testing, our tool provides the precision and convenience you need.
Try our P-score calculator now! Experience the difference that accurate, efficient statistical analysis can make in your research and decision-making process.