Pearson Correlation Calculator
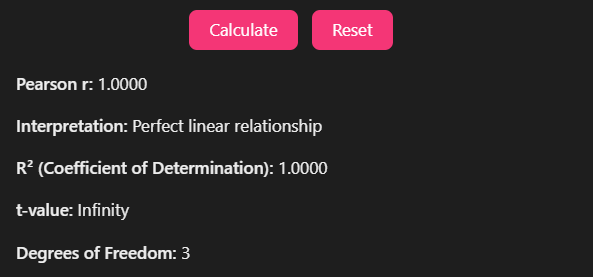
Pearson r: -
Interpretation: -
R² (Coefficient of Determination): -
t-value: -
Degrees of Freedom: -
Measuring relationships between variables has never been more accessible. With advanced statistical tools and enhanced algorithms, 2025 brings our powerful free calculator that makes Pearson correlation analysis simple for everyone from students to seasoned researchers.
What is Pearson Correlation?
The Pearson correlation coefficient (r) measures the strength and direction of linear relationships between two continuous variables. This statistical measure ranges from -1 to +1, providing crucial insights into how variables move together.
Understanding the Correlation Scale
- r = +1: Perfect positive correlation (variables increase together)
- r = -1: Perfect negative correlation (one variable increases as the other decreases)
- r = 0: No linear relationship exists between variables
Types of Correlations
Positive Correlation: When both variables move in the same direction. Higher values in one variable correspond to higher values in the other.
Negative Correlation: Variables move in opposite directions. As one increases, the other decreases consistently.
Zero Correlation: No discernible linear pattern exists between the variables, indicating independence.
Requirements for Using Pearson Correlation
Before calculating Pearson correlation, ensure your data meets these essential requirements:
Scale of Measurement
Variables must be measured on interval or ratio scales. This means your data should have equal intervals between values and, for ratio scales, a meaningful zero point.
Normal Distribution
Both variables should follow approximately normal distributions. This assumption ensures the correlation coefficient accurately represents the relationship strength.
Linear Association
The relationship between variables must be linear. Non-linear relationships require different analytical approaches.
Absence of Outliers
Extreme values can significantly skew correlation results. Remove or address outliers before analysis to ensure accurate findings.
How to Calculate Pearson Correlation
Manual Calculation Method
The Pearson correlation formula is:
r = Σ(xi – x̄)(yi – ȳ) / √[Σ(xi – x̄)²Σ(yi – ȳ)²]
Where:
- xi and yi are individual data points
- x̄ and ȳ are the means of each variable
- Σ represents the sum of all calculations
Step-by-Step Calculation Example
Let’s calculate correlation between study hours and exam scores:
Study Hours (X): 2, 4, 6, 8, 10
Exam Scores (Y): 65, 70, 80, 85, 90
Step 1: Calculate means
- X̄ = (2+4+6+8+10)/5 = 6
- Ȳ = (65+70+80+85+90)/5 = 78
Step 2: Calculate deviations and products
- (xi – x̄)(yi – ȳ) for each pair
- Sum of products = 200
Step 3: Calculate squared deviations
- Σ(xi – x̄)² = 40
- Σ(yi – ȳ)² = 250
Step 4: Apply formula
r = 200 / √(40 × 250) = 200 / 100 = 0.95
This strong positive correlation (0.95) indicates that increased study time strongly relates to higher exam scores.
Using Our Free Online Calculator
Our Modern free Pearson correlation calculator offer instant results with enhanced features:
- Input your data into designated fields
- Select calculation options (significance testing, confidence intervals)
- Review results including correlation coefficient, p-values, and interpretations
- Download or save results for future reference
Interpreting Correlation Results
Correlation Strength Guidelines
Following Cohen’s guidelines for effect sizes:
- |r| < 0.1: Very small effect
- 0.1 ≤ |r| < 0.3: Small effect
- 0.3 ≤ |r| < 0.5: Medium effect
- 0.5 ≤ |r|: Large effect
Understanding Covariance
Covariance measures how two variables change together. While correlation standardizes this relationship between -1 and +1, covariance has no upper or lower bounds.
Positive covariance: Variables increase together
Negative covariance: Variables move in opposite directions
Zero covariance: Variables are independent
The relationship between correlation and covariance:
r = Cov(X,Y) / (σX × σY)
Where σX and σY are standard deviations of X and Y respectively.
Statistical Significance
A correlation coefficient’s significance depends on:
- Sample size
- Chosen alpha level (typically 0.05)
- Degrees of freedom (n-2)
Larger sample sizes provide more reliable correlation estimates and greater statistical power.
Advantages of Using Our Free Calculator in 2025
Enhanced Accessibility and Convenience
Modern calculators work across all devices and platforms, enabling analysis anywhere, anytime. Cloud-based solutions ensure your data and results are always accessible.
Speed and Accuracy
Advanced algorithms process large datasets instantly while minimizing human error. Built-in validation checks ensure data quality before analysis.
Comprehensive Features
2025 calculators include:
- Significance testing with automatic p-value calculations
- Interactive visualizations showing scatter plots and regression lines
- Confidence intervals for correlation estimates
- Multi-format data import from CSV, Excel, and other sources
- Detailed step-by-step explanations for educational purposes
Updated Algorithms
Current calculators incorporate the latest statistical methods and computational improvements, ensuring more accurate results than older software versions.
Real-World Applications
Finance: Stock Market Analysis
Financial analysts use Pearson correlation to examine relationships between stock prices and interest rates. A correlation of -0.7 between stock prices and interest rates indicates that rising rates typically correspond to declining stock values, helping investors make informed decisions.
Healthcare: Lifestyle and Health Metrics
Researchers studying the relationship between exercise frequency and cholesterol levels found a correlation of -0.6, suggesting that increased exercise correlates with lower cholesterol levels. This finding supports lifestyle intervention programs.
Education: Academic Performance
Educational researchers analyzed study time and exam performance, discovering a correlation of 0.8. This strong positive relationship validates the importance of consistent study habits for academic success.
Marketing: Advertising Effectiveness
Marketing teams examine correlations between advertising spend and sales revenue. A correlation of 0.65 indicates that increased advertising investment generally leads to higher sales, justifying budget allocations.
Agriculture: Environmental Factors
Agricultural scientists study temperature and plant growth correlations. A correlation of 0.75 between temperature and crop yield within optimal ranges helps farmers optimize growing conditions.
Common Misinterpretations and Pitfalls
Correlation vs. Causation
Strong correlation doesn’t imply causation. Third variables may influence both measured variables, creating spurious correlations. Always consider alternative explanations and conduct additional analyses.
Influence of Sample Size
Small samples can produce unreliable correlation estimates. Large samples provide more stable results and better statistical power for detecting true relationships.
Outlier Effects
Extreme values can dramatically affect correlation coefficients. Always examine scatter plots and consider robust correlation methods when outliers are present.