Variance Calculator
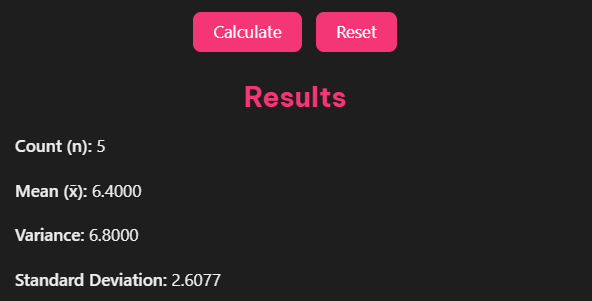
Results
Count (n): -
Mean (x̄): -
Variance: -
Standard Deviation: -
Step-by-Step Breakdown
Statistical analysis forms the backbone of data-driven decision making across countless industries. Whether you’re a student grappling with your first statistics course, a data scientist analyzing market trends, or a financial analyst assessing investment risks, understanding variance is crucial for making sense of your data. Our free sample variance calculator simplifies complex calculations while helping you master this fundamental statistical concept.
What is Variance and Why Does it Matter?
Variance measures how spread out data points are from the mean (average) of your dataset. Think of it as a statistical magnifying glass that reveals whether your data points cluster tightly around the average or scatter widely across different values.
Low variance indicates that your data points are consistent and predictable, clustered closely around the mean. High variance suggests greater variability, with data points spread across a wider range of values. This distinction becomes critical when assessing reliability, making predictions, or evaluating risk.
The relationship between variance and data interpretation extends far beyond academic exercises. In finance, high variance in stock returns signals greater investment risk. In manufacturing, variance analysis helps identify quality control issues. In education, understanding score variance helps teachers evaluate student performance consistency.
Understanding the Distinction: Population vs Sample Variance
One of the most important concepts in variance calculation is understanding when to use population versus sample variance formulas.
Population variance applies when you have data from every member of the group you’re studying. For example, if you’re analyzing test scores from all students in a specific class, you have the complete population.
Sample variance is used when your data represents only a portion of the larger group you want to understand. This scenario is far more common in real-world applications, as collecting data from entire populations is often impractical or impossible.
The key difference lies in the denominator: population variance divides by N (total number of data points), while sample variance divides by N-1. This adjustment, known as Bessel’s correction, accounts for the fact that sample data tends to underestimate population variance.
Variance Formulas: The Mathematical Foundation
Understanding the mathematical formulas behind variance calculations helps you interpret results more effectively.
Population Variance Formula
For complete population data:
σ² = Σ(xi – μ)² / N
Where:
- σ² represents population variance
- xi represents each individual data point
- μ represents the population mean
- N represents the total number of data points
Sample Variance Formula
For sample data:
s² = Σ(xi – x̄)² / (N-1)
Where:
- s² represents sample variance
- xi represents each individual data point
- x̄ represents the sample mean
- N-1 represents the sample size minus one (Bessel’s correction)
Understanding Bessel’s Correction
Bessel’s correction addresses a statistical bias that occurs when estimating population variance from sample data. Without this correction, sample variance consistently underestimates the true population variance. By dividing by N-1 instead of N, we get a more accurate estimate of the population variance.
Step-by-Step Variance Calculation Guide
Calculating variance manually helps deepen your understanding of the concept. Here’s a comprehensive walkthrough:
Step 1: Calculate the Mean
Add all data values together and divide by the number of values:
Mean = (x₁ + x₂ + x₃ + … + xₙ) / N
Step 2: Find Each Deviation from the Mean
For each data point, subtract the mean:
Deviation = xi – mean
Step 3: Square Each Deviation
Square each deviation to eliminate negative values:
Squared deviation = (xi – mean)²
Step 4: Calculate the Variance
Sum all squared deviations and divide by the appropriate denominator:
- For population: Variance = Σ(squared deviations) / N
- For sample: Variance = Σ(squared deviations) / (N-1)
Applications of Variance in Different Fields
Variance analysis serves numerous practical purposes across various industries and academic disciplines.
Data Reliability Assessment
Variance helps determine how reliable your data is. Low variance suggests consistent, dependable measurements, while high variance may indicate measurement errors, external factors, or natural variability in the phenomenon being studied.
Decision-Making Processes
Business leaders use variance to evaluate options and assess risk. Marketing campaigns with low variance in customer response rates suggest predictable outcomes, while high variance indicates unpredictable results that require careful consideration.
Statistical Hypothesis Testing
Variance plays a crucial role in many statistical tests, including t-tests, ANOVA, and regression analysis. These tests compare variances between groups to determine if observed differences are statistically significant.
Using Our Free Sample Variance Calculator
Our calculator streamlines the variance calculation process while providing educational value through detailed step-by-step solutions.
Key Features
- Dual functionality: Calculate both population and sample variance
- Step-by-step solutions: Understand each calculation step
- Multiple input formats: Enter data as comma-separated values, spaces, or line breaks
- Additional statistics: Get mean, standard deviation, and sum of squares
- Mobile-friendly interface: Use on any device, anywhere
How to Use the Calculator
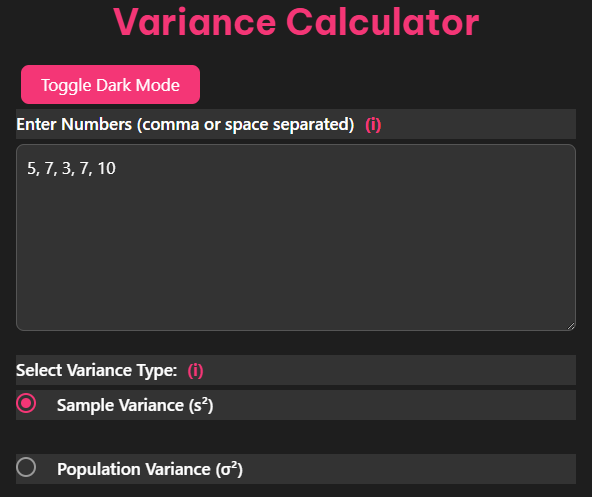
- Select your data type: Choose between sample or population variance
- Enter your data: Input values separated by commas, spaces, or line breaks
- Click calculate: Get instant results with detailed explanations
- Review the solution: Study the step-by-step breakdown to enhance understanding
The calculator handles datasets of any size, from small class assignments to large research projects.
Real-World Examples
Let’s explore practical applications through detailed examples that demonstrate variance calculation in context.
Example 1: Quiz Score Analysis
A teacher wants to analyze the consistency of quiz scores. The scores are: 5, 5, 5, 7, 8, 8, 9, 9.
Step 1: Calculate the mean
Mean = (5 + 5 + 5 + 7 + 8 + 8 + 9 + 9) ÷ 8 = 56 ÷ 8 = 7
Step 2: Find deviations from the mean
5 – 7 = -2, 5 – 7 = -2, 5 – 7 = -2, 7 – 7 = 0, 8 – 7 = 1, 8 – 7 = 1, 9 – 7 = 2, 9 – 7 = 2
Step 3: Square the deviations
(-2)² = 4, (-2)² = 4, (-2)² = 4, (0)² = 0, (1)² = 1, (1)² = 1, (2)² = 4, (2)² = 4
Step 4: Calculate variance
Sum of squared deviations = 4 + 4 + 4 + 0 + 1 + 1 + 4 + 4 = 22
Sample variance = 22 ÷ (8-1) = 22 ÷ 7 = 3.14
This moderate variance suggests reasonable consistency in quiz performance, with most students scoring close to the average.
Example 2: Investment Portfolio Analysis
A financial analyst compares two investment portfolios by examining their return variances over five periods.
Portfolio A returns: 8%, 9%, 10%, 11%, 12%
Portfolio B returns: 2%, 6%, 10%, 14%, 18%
Portfolio A Analysis:
Mean = (8 + 9 + 10 + 11 + 12) ÷ 5 = 10%
Deviations: -2, -1, 0, 1, 2
Squared deviations: 4, 1, 0, 1, 4
Variance = 10 ÷ 4 = 2.5
Portfolio B Analysis:
Mean = (2 + 6 + 10 + 14 + 18) ÷ 5 = 10%
Deviations: -8, -4, 0, 4, 8
Squared deviations: 64, 16, 0, 16, 64
Variance = 160 ÷ 4 = 40
Portfolio B shows significantly higher variance (40 vs 2.5), indicating greater risk despite having the same average return.
Example 3: Website Performance Optimization
A web developer measures page loading times to optimize performance: 1.2, 1.5, 1.8, 2.1, 2.4 seconds.
Step 1: Calculate mean
Mean = (1.2 + 1.5 + 1.8 + 2.1 + 2.4) ÷ 5 = 1.8 seconds
Step 2: Find deviations
1.2 – 1.8 = -0.6, 1.5 – 1.8 = -0.3, 1.8 – 1.8 = 0, 2.1 – 1.8 = 0.3, 2.4 – 1.8 = 0.6
Step 3: Square deviations
0.36, 0.09, 0, 0.09, 0.36
Step 4: Calculate variance
Sum = 0.9, Sample variance = 0.9 ÷ 4 = 0.225
The low variance indicates consistent loading times, suggesting good website performance across different pages.