Sxx Value Calculator
Results
n: -
Mean (x̄): -
Σx: -
Σx²: -
Sxx: -
Statistical analysis forms the backbone of data-driven decision making across countless industries. Whether you’re a student grappling with regression models or a professional analyzing market trends, understanding the sum of squared deviations commonly known as Sxx is essential for accurate statistical computations.
The Sxx value represents a fundamental building block in correlation analysis, regression modeling, and hypothesis testing. Yet many existing calculators fall short of providing the comprehensive features and intuitive experience that today’s users demand. That’s why we’ve developed our advanced Sxx value calculator for 2025, designed to bridge the gap between complex statistical theory and practical application.
Understanding the Sxx Formula: A Complete Breakdown
The Sxx value, mathematically expressed as the sum of squared deviations from the mean, serves as a cornerstone in statistical analysis. The formula appears deceptively simple, but understanding its components reveals the depth of its statistical significance.
The Standard Formula:
Sxx = Σ(xi – x̄)² = Σx² – n(x̄)²
Where:
- xi represents each individual data point
- x̄ is the mean of all x values
- n is the total number of data points
- Σ indicates summation across all values
Breaking Down Each Component
The first component, Σ(xi – x̄)², calculates the squared difference between each data point and the mean. This squaring process eliminates negative values while emphasizing larger deviations, making it particularly useful for identifying outliers and measuring variability.
The alternative formulation, Σx² – n(x̄)², offers computational advantages, especially when working with large datasets. This version reduces rounding errors and simplifies calculations when you already have the sum of squares and the mean.
Statistical Significance
Sxx measures the total variation in your x-variable data. A higher Sxx value indicates greater spread in your data points, while a lower value suggests the points cluster more closely around the mean. This information proves crucial when assessing the reliability of regression models and correlation coefficients.
Understanding this variability helps researchers and analysts make informed decisions about data quality, model appropriateness, and the strength of relationships between variables.
Real-World Applications: How Industries Use Sxx
The versatility of Sxx calculations extends far beyond academic statistics, finding practical applications across numerous industries and research fields.
Financial Risk Management
For example, a mutual fund manager might calculate Sxx values for different securities to understand which investments contribute most to overall portfolio volatility. This analysis helps optimize asset allocation and manage risk exposure according to investor preferences.
Manufacturing and Quality Control
An automotive parts manufacturer might track the Sxx of bolt diameters across production batches. Increasing Sxx values could indicate equipment wear, calibration drift, or process instabilities that require immediate attention.
Medical Research and Clinical Trials
Consider a pharmaceutical company testing a new blood pressure medication. Calculating Sxx for blood pressure readings before and after treatment helps determine whether the medication consistently reduces hypertension across diverse patient populations.
Environmental Science and Climate Research
Researchers studying air quality might calculate Sxx values for particulate matter concentrations across different monitoring stations. This analysis reveals spatial variability and helps identify pollution hotspots requiring targeted interventions.
Sports Analytics and Performance Analysis
A basketball team might calculate Sxx for player shooting percentages across different game situations. This analysis reveals which players perform consistently under pressure and which might benefit from additional training or modified roles.
Marketing and A/B Testing
An e-commerce company running A/B tests might calculate Sxx for conversion rates across different website designs. This analysis helps determine whether observed differences represent meaningful improvements or random variation.
Step-by-Step Guide: Using Our Sxx Calculator
Getting started with our Sxx calculator is straightforward, but understanding the full range of features helps you maximize its potential for your specific analytical needs.
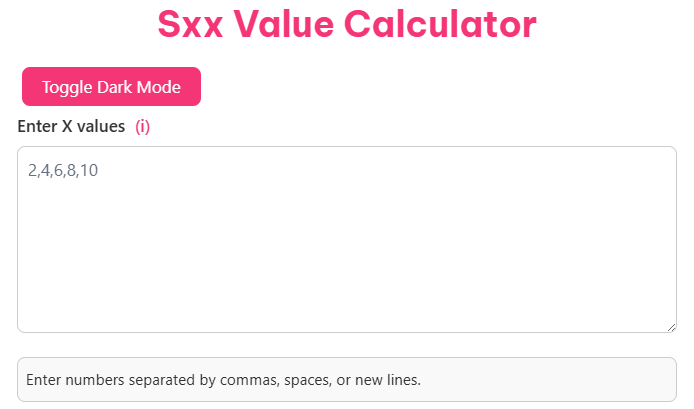
Data Entry Methods
The calculator supports multiple data entry methods to accommodate different workflows and data sources. You can manually enter individual values, paste data from spreadsheets, or upload CSV files for batch processing.
Calculation Options
Select your preferred calculation method based on your specific requirements and data characteristics. The standard method works well for most applications, while the computational formula offers advantages for large datasets with many decimal places.
Interpreting Results
The calculator displays your Sxx value prominently, along with supporting statistics that provide context for interpretation. Related metrics include the mean, standard deviation, and coefficient of variation.
Exporting and Sharing
Results can be exported in multiple formats suitable for different purposes. Generate PDF reports for presentations, download CSV files for further analysis, or copy formatted results directly to your clipboard.
Maximizing Your Statistical Analysis Success
Understanding Sxx calculations represents just the beginning of effective statistical analysis. Success depends on applying these tools appropriately within broader analytical frameworks and decision-making processes.
Take the next step in your statistical journey by exploring our free Sxx value calculator. Experience the difference that thoughtful design, advanced features, and reliable accuracy can make in your analytical work.